The Marketer’s Go-To Guide for Creating Data-Based Content
Originally published by HubSpot.
We inbound marketers are a unique bunch. One day we love to dream up lovable campaigns to delight our audience, and the next we want nothing more than to dive into some data. As more and more companies begin to turn on their inbound marketing machine and start creating content, let’s remember that our inherent data chops as marketers can help us create content that’s high-quality, shareable, and insightful.
Luckily, we’re also living in the age of social media, big data, and … well, the internet … where myriad tools and technologies help us harness the data that’s at our fingertips and use it to improve our content strategies. Together, we’ll look at how you can use that data to help shape the content you produce, and how to build data-based content to help make your content stand out from the crowd.
Some Tips and Tools to Help You Collect and Harness Data
The growth of social media has led to an explosion in how much personal data there is about people on the web. When Austrian student Max Schrems requested the data Facebook collected on him, it amounted to 1,222 pages. Now, consider that there are more than a billion monthly active users on Facebook. That’s a whole lot of data existing on just one social network.
Seems like with all that data, marketers could harness it to somehow inform their content strategy, right? Why yes, they can. The following tools can help you use social data to help make decisions about what content you should be producing for your audience.
1) SocialCrawlytics
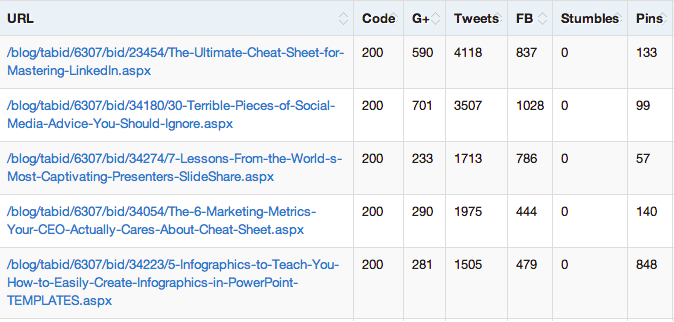
SocialCrawlytics is a great tool to help figure out what content produced by your competitors is resonating with their audience — who you just may want to reach, too. It crawls a site and shows how many social shares each URL has gotten.

There is also an API for SocialCrawlytics so you can start creating dashboards for your competitors’ most shared content and easily spot what topics are performing best.
2) Bottlenose
Bottlenose is a great tool for real-time marketing. It allows you to spot real-time trends in your market so you can start producing content and engaging with influencers around those trends. For an example of this in practice, check out the following case study from Razorfish on slide 42 of this presentation.

3) SocialMention
SocialMention looks for mentions of a topic across a huge selection of social properties. It can show some interesting data, like the sentiment of a topic, top users for that topic (which is good for finding influencers), top hashtags associated with that topic, and the top sources for that topic (good for knowing where you should be sharing your content on that topic). It doesn’t have an API, but does allow you to export to CSV, so you can manipulate the data with some Excel skills.
4) HubSpot
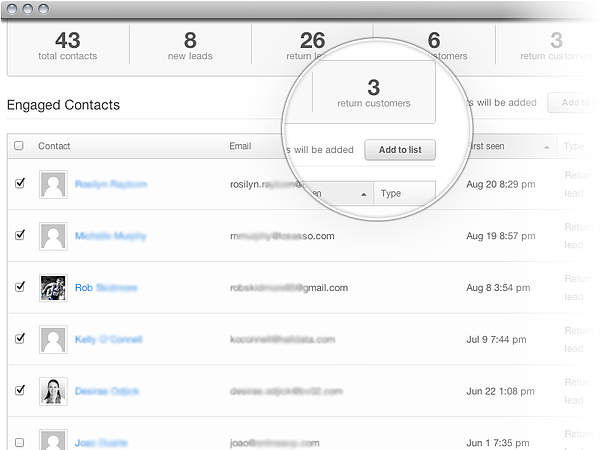
And of course, HubSpot customers can use our software to harness all the social data out there, particularly to determine how the content they’re sharing resonates with their audience, and how that engagement drives bottom-line metrics, like customer generation. Tracing back content to follower-, lead-, and customer-generation — and even being able to look up information on individual social contacts — is the ultimate indicator of what kind of content you should be publishing more of, and less of, on social media.

There are also some more traditional, tried-and-true methods of gathering data that don’t require you to adapt to a new technology or software platform.
5) Lead and Customer Data
If your business happens to aggregate data that’s of use to you in creating or informing content, you don’t want to neglect it. Here at HubSpot, for example, we use lead and customer data to inform our content strategy on a daily basis, because we use our software on a daily basis. And, well, a big part of our software is data collection and analysis. If you have a product or service that inherently collects lead and customer data, you could use that to inform your content strategy, and to improve content quality.
6) Survey Data
Surveying your audience is a great way to gather the information you need to create some unique, data-based content that’s directly reflective of your target personas. The difficulty for this type of data collection is volume — you need to get enough people to complete the survey to make it statistically significant. If you need help with this data collection method, we’ve created a free ebook you can download to guide you through the process, The Ultimate Guide to Using Surveys in Your Marketing.
7) External Sources
Finally, there are a number of external data sources you can use to produce some great data-based content. All you need is a little bit of technical know-how. If you’re tech-savvy, a great source for data-based content is APIs. You can use Mashape and ProgrammableWeb to search for relevant APIs to get some data for your content. For a great example of data-based content using APIs, check out this piece from the Guardian, which uses data from Twitter to show how rumors spread on the platform.
If you’re a little less comfortable with this method of data collection, you can also turn to search engines that aggregate data for you — sites like Factbrowser make searching for and surfacing data in your particular industry simple.
How to Use All That Data in Your Content
Data can be used for more than just getting a feel of the content marketplace — it should also be used in your content to make it stand out. Once you have all that lovely data to play with, you want to make sure you get a heap of value from it. Here are some really high-ROI, blow-out content ideas you can now create because of all the data you’ve collected.
1) Your Company’s Annual Report
If you’ve got a handle on your internal and customer success data, an annual company report is a great first step to releasing it all in a mix of PR and storytelling. This won’t be lead generation content for you, but it’s a welcome reprieve from the press releases touting company benchmarks, because it actually tells a story about what your company’s been doing the past 12 months. From there, press outlets can do their own thing, grabbing the most compelling data points and building out their own stories from there.
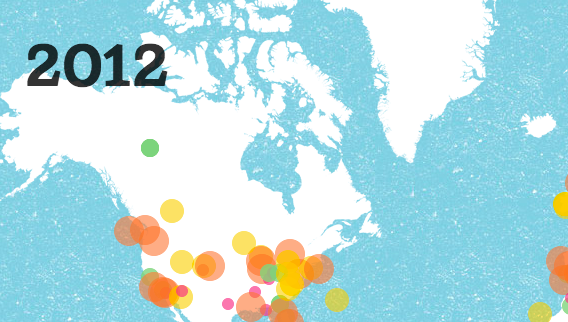
We did this recently with our own 2012 annual report — also creating a SlideShare to help the content spread further and better visually represent the data. I’d also check out the annual report AirBnB puts out, as they’re an excellent example of creating a visually stunning content asset that tells a story with the data they’ve compiled.

2) An Industry-Focused Annual Report
You can also turn your data and research chops outward, focusing on what industry insights your research has uncovered. This can turn into an annual report your company releases to your industry, and positions you as not only a thought leader, but helps generate you leads.
We do this every year with our State of Inbound Marketing Report — the next iteration coming soon, everyone! — as does Adobe with their annual reports around digital marketing. Check out their annual State of Online Advertising Report here for one example.
3) New Industry Data Analysis
Sometimes you’ll have data that isn’t part of a year-long story, but is still ground-breaking stuff that could change the way people think about a facet of your industry. These are likely the stats that you’ll pull out of more casual online research, other people’s reports, or from looking at your own internal strategies. These, too, warrant their own content assets — whether a piece of lead generation material, or simply a blog post. (Hint: These might end up being some of your most successful blog posts.)
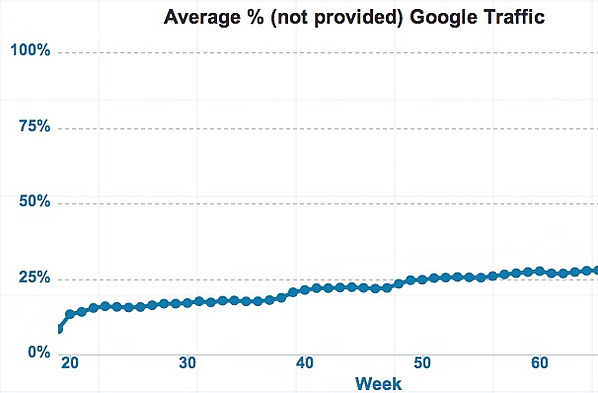
This interactive chart from ClickConsult, for instance, is tracking the growth of keyword (not provided) across the traffic of 60 websites. This is important because it highlights the growing number of businesses that can’t get an accurate reading of what keywords are driving traffic to their site due to SSL encryption.

Being able to produce a piece of content — whether a tool, or a static piece of content — that reports on the trends in your market is another way to help you build authority, capture lots of traffic and leads, and earn a heap of PR.
4) Case Study Content
Putting numbers around the success customers have had with your product or service, or even showing data that represents how useful your product or service can be, is another fantastic way to leverage data you’ve collected for a more bottom-of-the-funnel piece of marketing content.
We do this all the time with our own case studies, highlighting data that describes the success customers have had with our software. In other words, instead of relying on vague and anecdotal evidence like “our marketing improved,” we rely on several more concrete data points to tell the story, like “we saw a 129% increase in revenue.”
You can also take a route similar to SEOmoz and Inbound.org, in which @KaneJamison pulled together a report after being granted access to Inboung.org data to produce a set of awesome insights around the platform.

5) Benchmarking Data
Finally, consider creating some benchmarking data for your industry. Benchmarking data is fantastic because people refer to it over, and over, and over, and it helps establish you as the thought leader — the arbiter of success, even — in your industry. We leveraged our data, for instance, when we published Marketing Benchmarks From 7,000 Businesses. Even if your product or service doesn’t help you get access to data of this nature, consider partnering with a research firm or another company that does have access to this type of data. I see a promising co-marketing relationship there, don’t you?
Once you have one of these content pieces ready, you should think about how it can be turned into a campaign with multiple content formats. For example, if you have an annual survey, it can be turned into one complete report, a number of smaller reports segmented for different audiences, a webinar to present your findings (add an influencer for bonus points), tweaking the presentation so you can add it to SlideShare, a number of blog posts discussing topics raised by the report, and maybe even some type of interactive visualization. Data-based content is a lot more time intensive than normal content — but the insight you glean from all that research can be monumental! New, data-based information — or even new ways data helps you slice and dice a common problem — makes for truly helpful, insightful content. Spend time thinking of ways to get the most out of your time investment in that content as possible.
11 Essentials to Digitize Your Sales Process
Get the strategy you need to take your sales process digital quickly.
